Scope
This comparison applies two essay scorers trained on the ELLIPSE corpus to anonymous Swedish upper-secondary essays. It tests whether the scorers produce an ordered course pattern. It does not equate an ELLIPSE score with a Swedish grade, and the Swedish essays were not used to train either scorer.
The transparent scorer uses inspectable text measures. The hybrid scorer adds a language-model representation of the complete essay. Both use the same 1-to-5 ELLIPSE scale.
ELLIPSE reference distributions
The ELLIPSE training labels have a median of 3.000. The two scorers produce similar distributions on the ELLIPSE training and test material.
| Scorer and partition | n | Median | Mean | 25th percentile | 75th percentile | Values at 4.0 or above |
|---|---|---|---|---|---|---|
| ELLIPSE training labels | 3,481 | 3.000 | 3.137 | 2.500 | 3.500 | 18.4% |
| Transparent, training out-of-fold | 3,479 | 3.152 | 3.153 | 2.789 | 3.517 | 4.8% |
| Transparent, test | 2,259 | 3.164 | 3.160 | 2.787 | 3.554 | 5.5% |
| Hybrid, training out-of-fold | 3,479 | 3.130 | 3.140 | 2.747 | 3.518 | 5.6% |
| Hybrid, test | 2,259 | 3.117 | 3.141 | 2.751 | 3.552 | 5.7% |
The training and test medians differ by 0.011 for the transparent scorer and 0.013 for the hybrid scorer. The scorer results on ELLIPSE are therefore consistent across the training and test partitions. The predicted distributions contain fewer values at 4.0 or above than the human labels.
Swedish course distributions on the ELLIPSE scale
The table reports each classroom cohort separately. “Difference from ELLIPSE” means the difference between the cohort median and the ELLIPSE training-label median of 3.000.
| Course cohort | Essays | Transparent median | Difference from ELLIPSE | Hybrid median | Difference from ELLIPSE | Transparent at 4.0 or above | Hybrid at 4.0 or above |
|---|---|---|---|---|---|---|---|
| English 1 VT2026 | 22 | 3.246 | +0.246 | 3.379 | +0.379 | 9.1% | 18.2% |
| English 5 VT2017 | 46 | 3.523 | +0.523 | 3.512 | +0.512 | 4.3% | 23.9% |
| English 6 VT2023, assignment A | 60 | 3.917 | +0.917 | 3.960 | +0.960 | 38.3% | 48.3% |
| English 6 VT2023, assignment B | 62 | 4.125 | +1.125 | 4.141 | +1.141 | 54.8% | 59.7% |
| English 7 VT2017 | 24 | 4.264 | +1.264 | 4.335 | +1.335 | 66.7% | 75.0% |
| English 7 VT2018 | 7 | 4.147 | +1.147 | 4.124 | +1.124 | 85.7% | 57.1% |
Both scorers produce the same course order from English 1 and English 5 through the two English 6 cohorts to English 7 VT2017. English 7 VT2018 contains only seven essays and has a slightly lower median than English 7 VT2017.
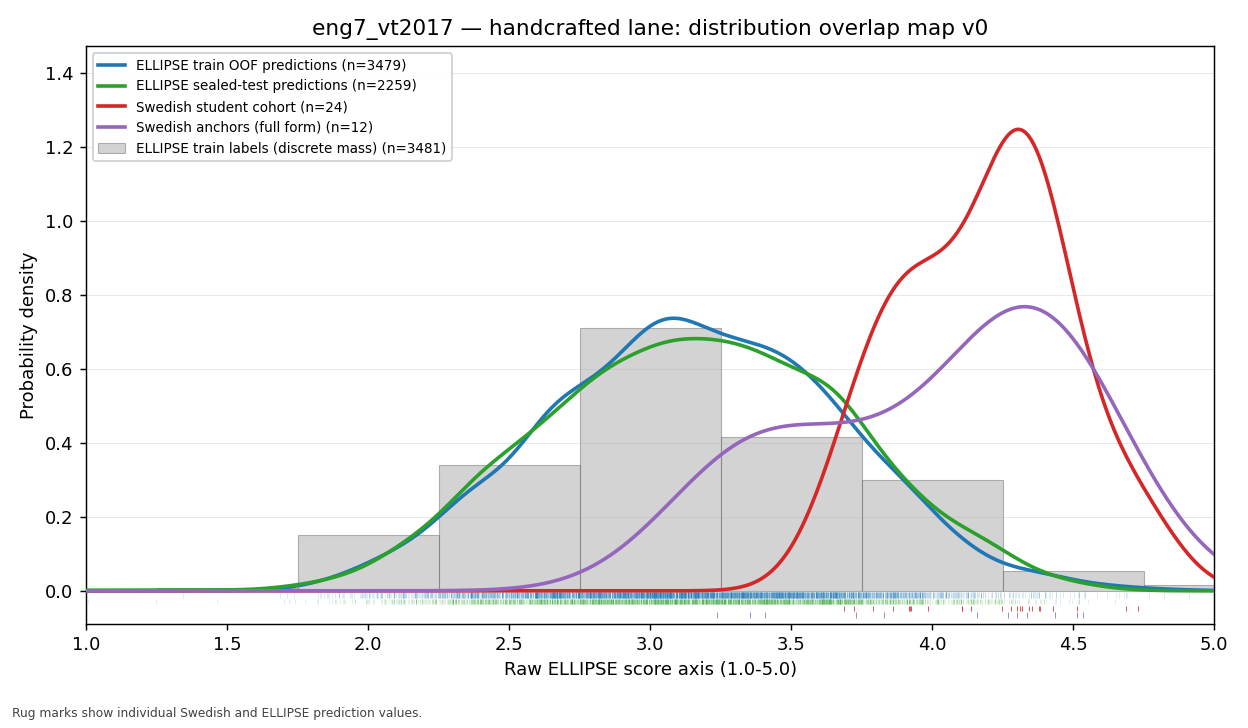
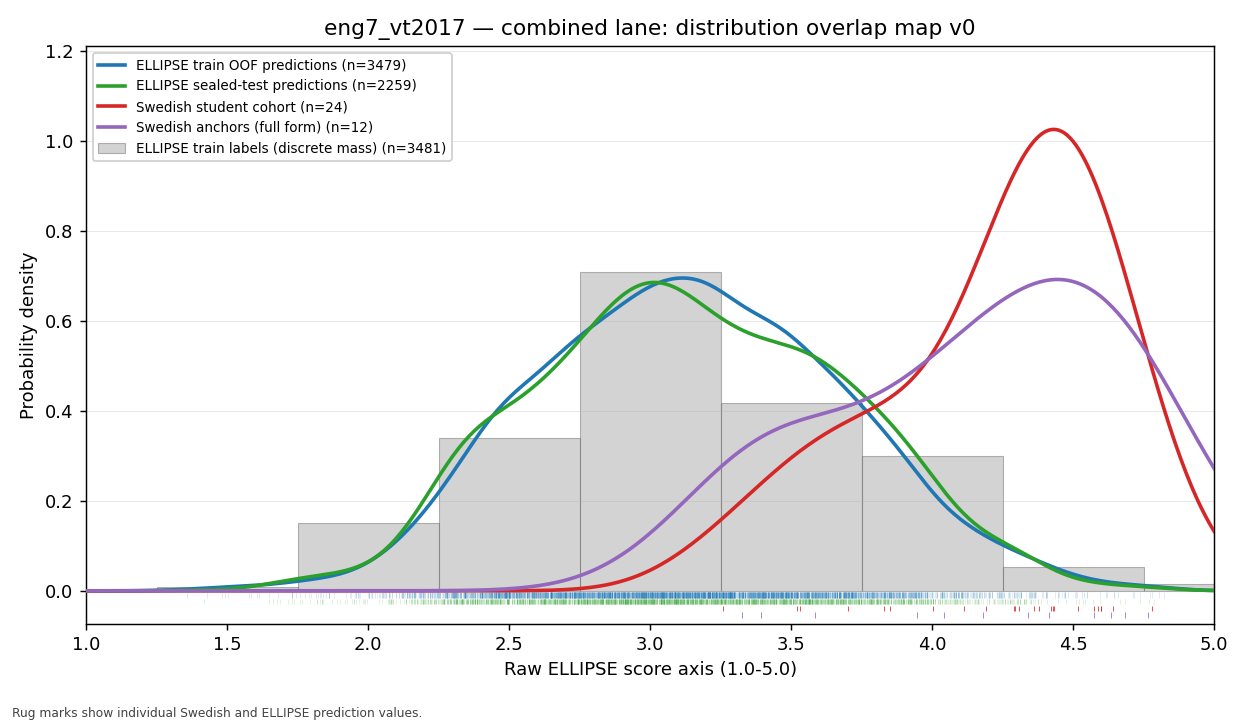
The difference of approximately 1.3 scale points for English 7 VT2017 is large in relation to the observed distributions. Between 66.7 and 75.0 percent of that cohort receives a value of 4.0 or above. The corresponding proportion in the ELLIPSE scorer results is 4.8 to 5.7 percent. English 7 VT2017 is therefore concentrated in a part of the scale that contains only a small proportion of the ELLIPSE predictions.
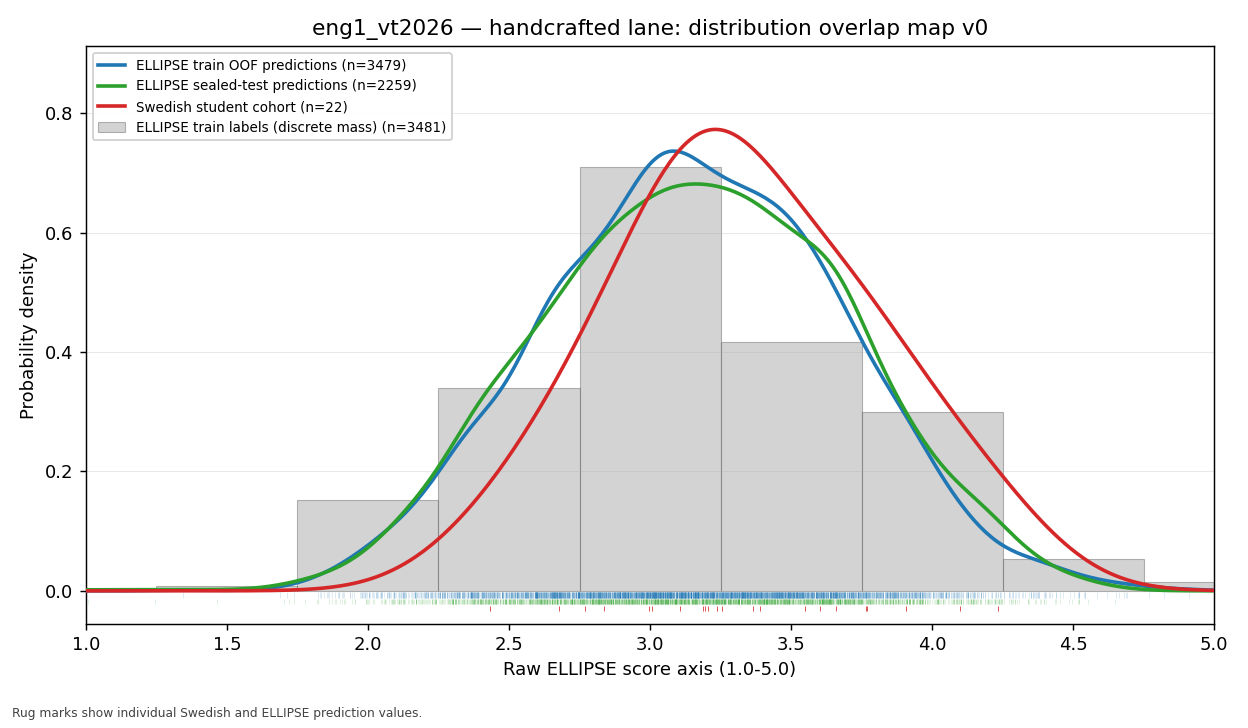
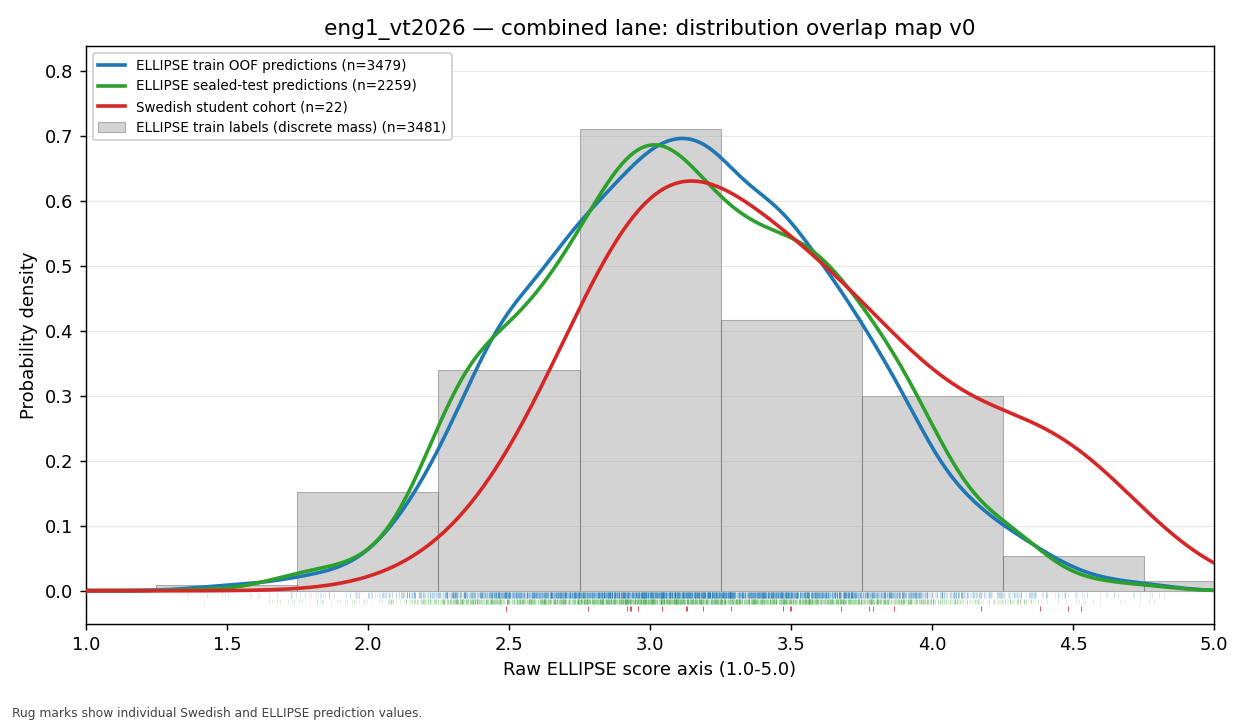
The English 5 and English 1 cohorts are much closer to the ELLIPSE median than English 6 and English 7. This supports a research hypothesis that ELLIPSE may provide more relevant coverage for earlier Swedish course levels and perhaps Year 9 than for English 6 and English 7. The present data cannot test the Year 9 part of that hypothesis because no Year 9 national-test essays are included.
Anchor comparisons
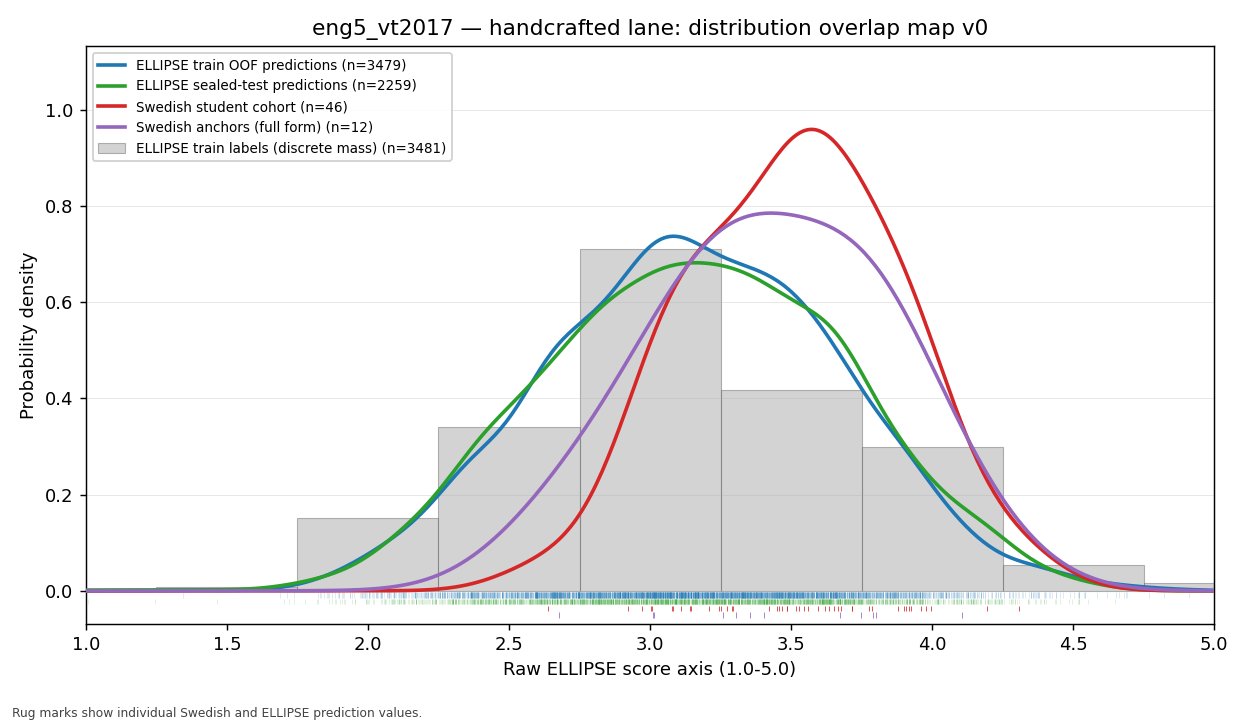
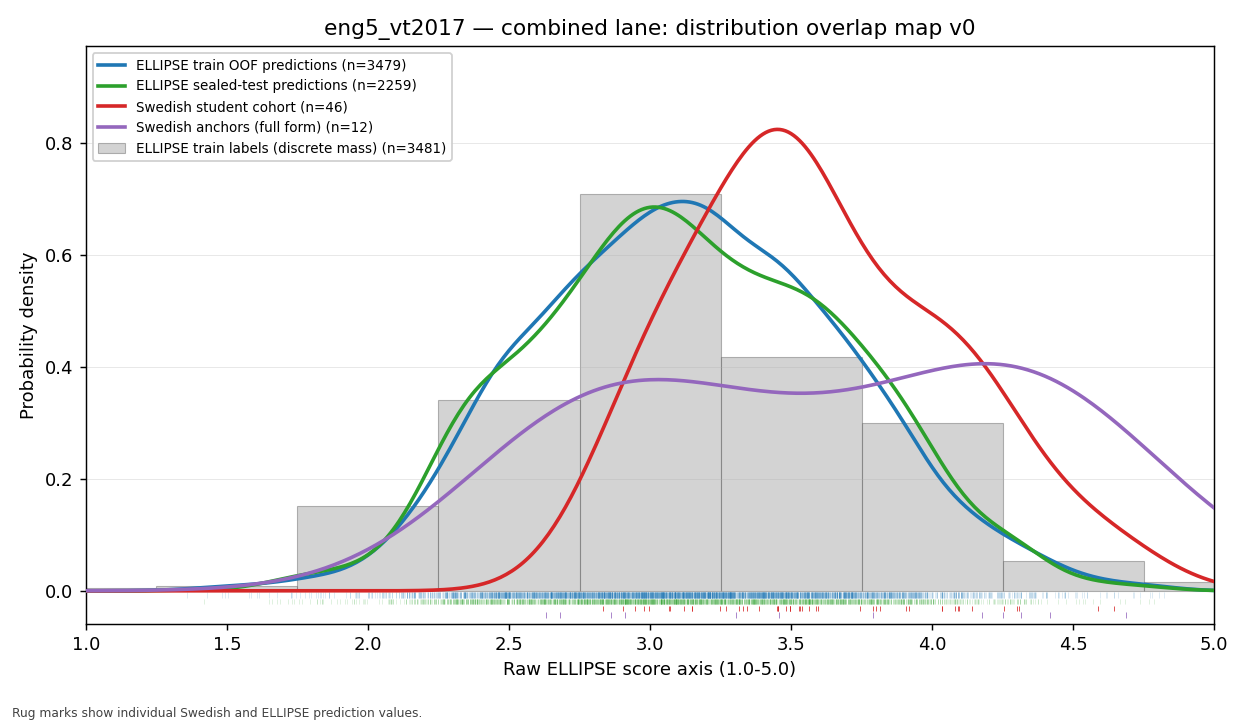
The anchor essays are official assessment exemplars, separate from the classroom cohorts. English 1 VT2026 has no anchor comparison in this analysis. The English 6 VT2023 anchor set is the same for assignments A and B.
| Anchor set | Essays | Transparent median | Difference from ELLIPSE | Hybrid median | Difference from ELLIPSE |
|---|---|---|---|---|---|
| English 5 VT2017 | 12 | 3.378 | +0.378 | 3.624 | +0.624 |
| English 6 VT2023 | 10 | 3.862 | +0.862 | 4.096 | +1.096 |
| English 6 VT2026 | 9 | 3.685 | +0.685 | 3.904 | +0.904 |
| English 7 VT2017 | 12 | 4.214 | +1.214 | 4.259 | +1.259 |
| English 7 VT2018 | 9 | 4.094 | +1.094 | 4.625 | +1.625 |
For the four course years that include both classroom essays and anchors, the two medians are similar. The English 6 VT2026 anchor set contains nine essays and has no independent classroom cohort in this comparison.
English 6 VT2026 data exclusion
The classroom results exclude English 6 VT2026 because 59 of its 60 records duplicate records in English 6 VT2023 assignment B. Fifty-seven of those pairs remain identical after text normalization. Including both registrations as independent cohorts would count the same essays twice. English 6 VT2023 assignment B provides the classroom results for that essay population. The English 6 VT2026 anchor essays remain in the anchor comparison.
Across the included and registered classroom records, 281 scored rows correspond to 224 distinct essay texts. Any pooled calculation over all 281 rows would count the duplicated essays twice, so this page reports cohorts separately and excludes the duplicated English 6 VT2026 classroom series.
Distribution figures
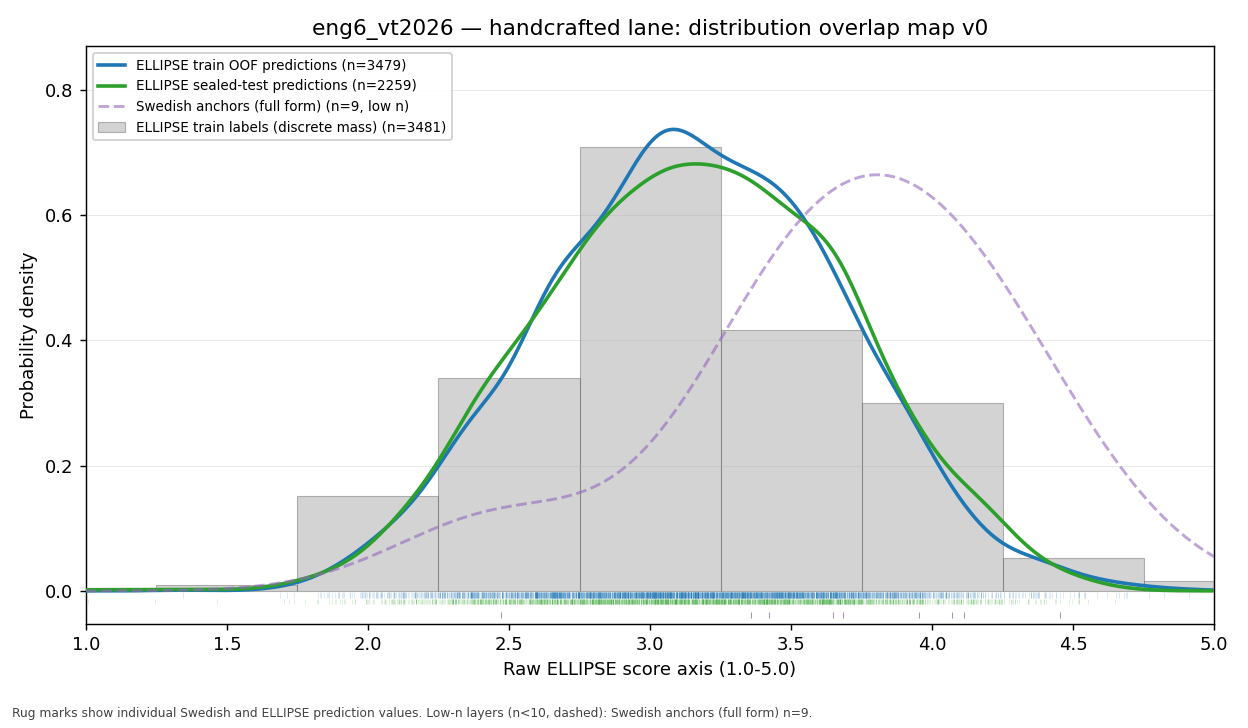
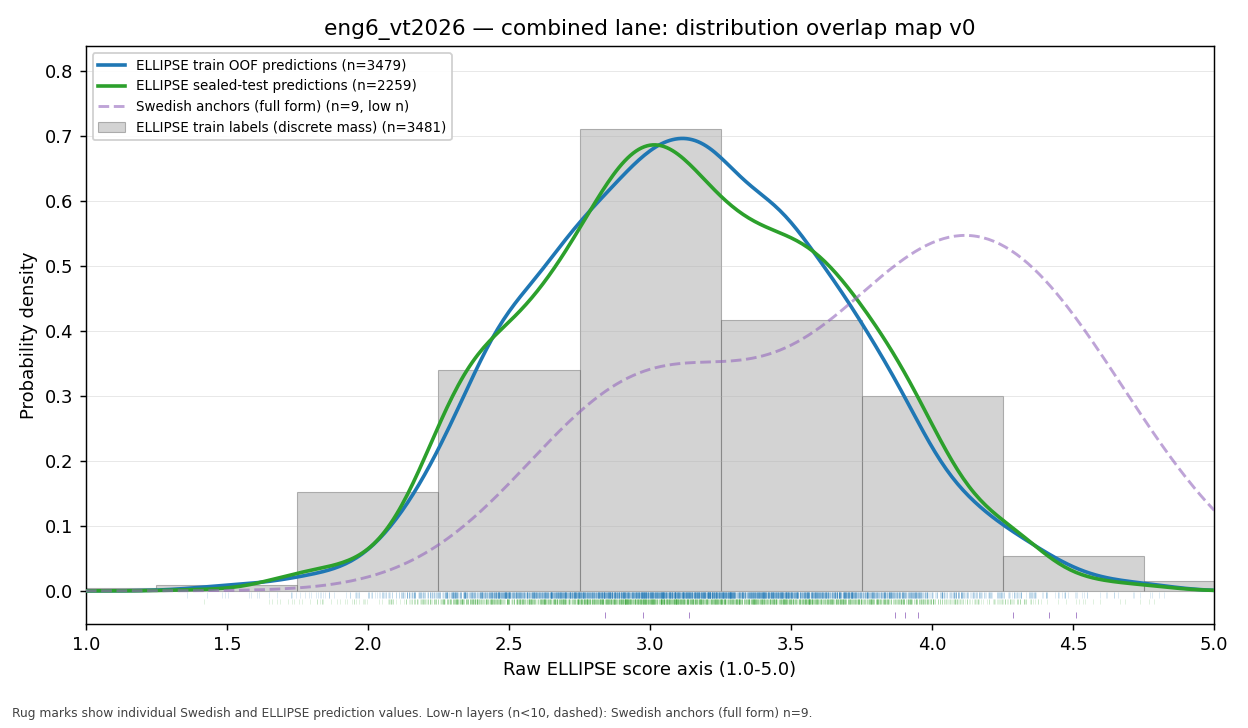
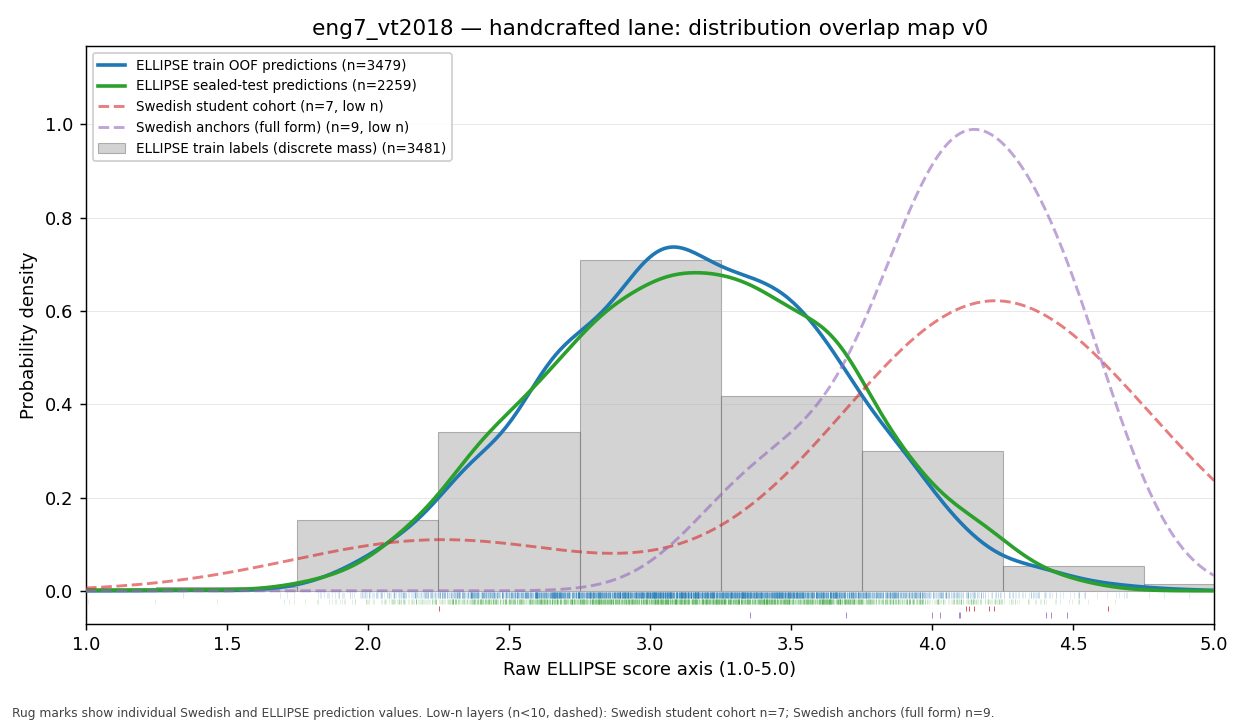
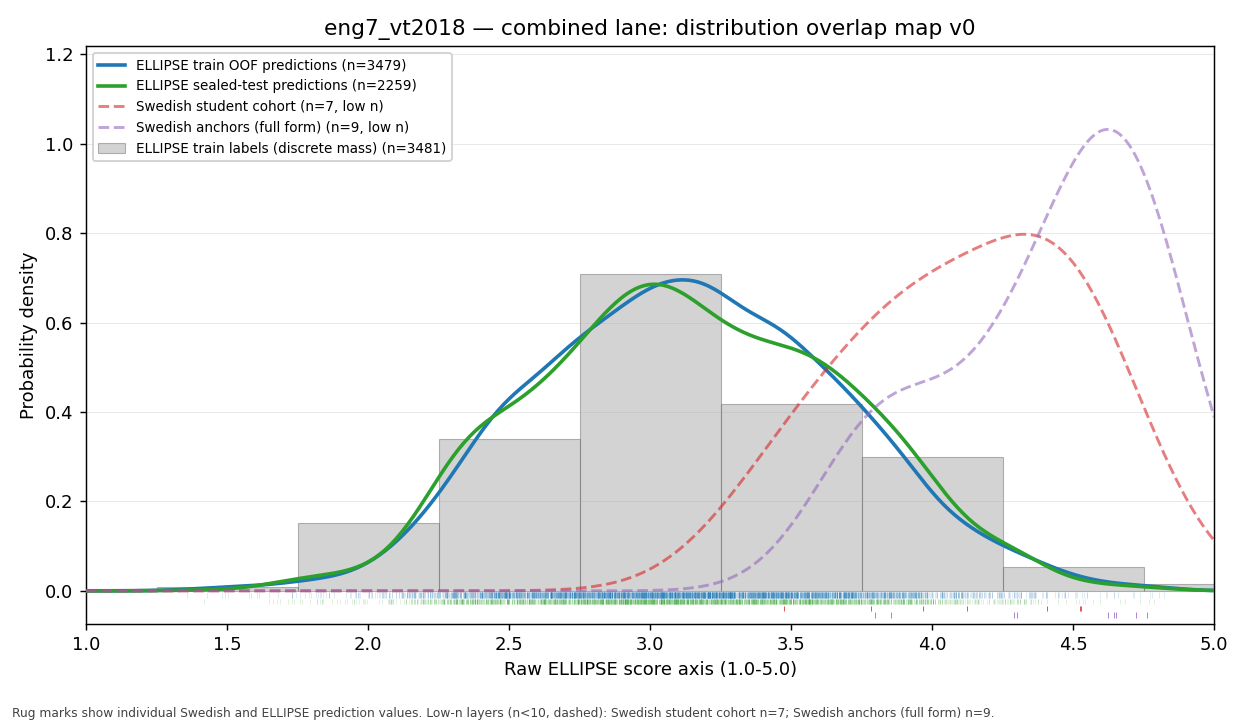
Each figure shows the ELLIPSE training labels, the scorer results for ELLIPSE, the Swedish classroom cohort when available, and the official anchor essays when available. The marks below the curves show the individual values.
English 1 VT2026
English 5 VT2017
English 6 VT2023, assignment A
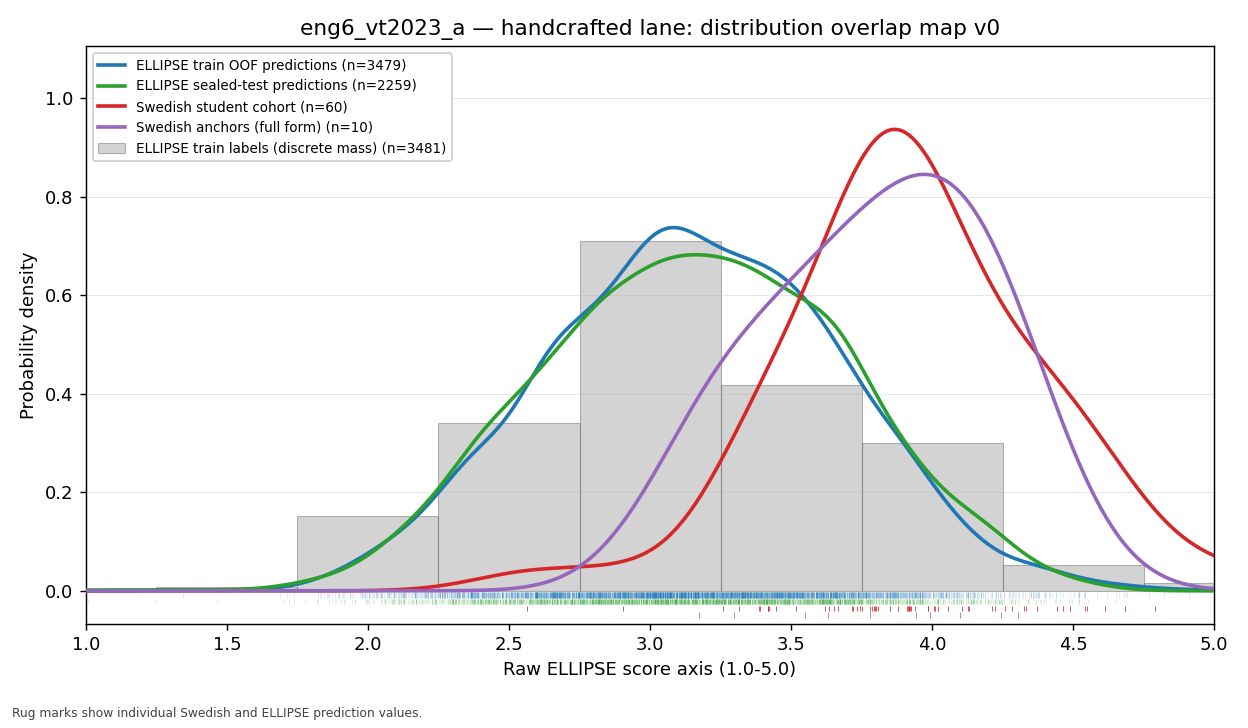
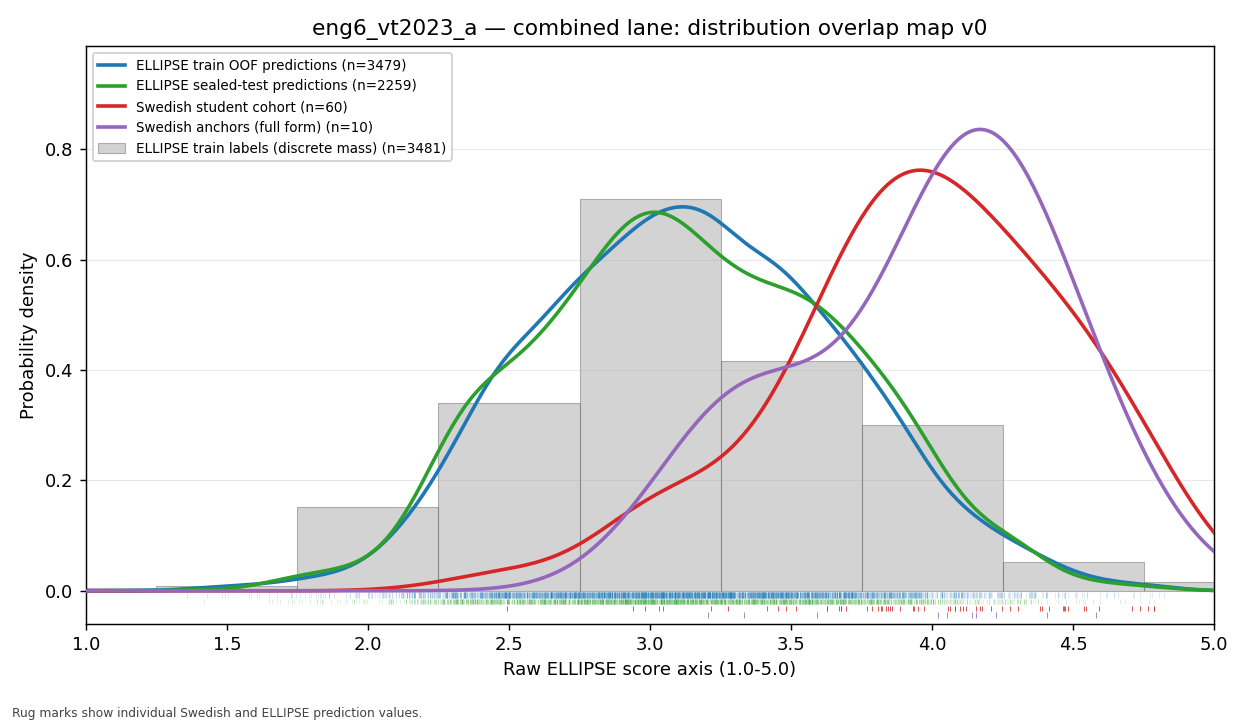
English 6 VT2023, assignment B
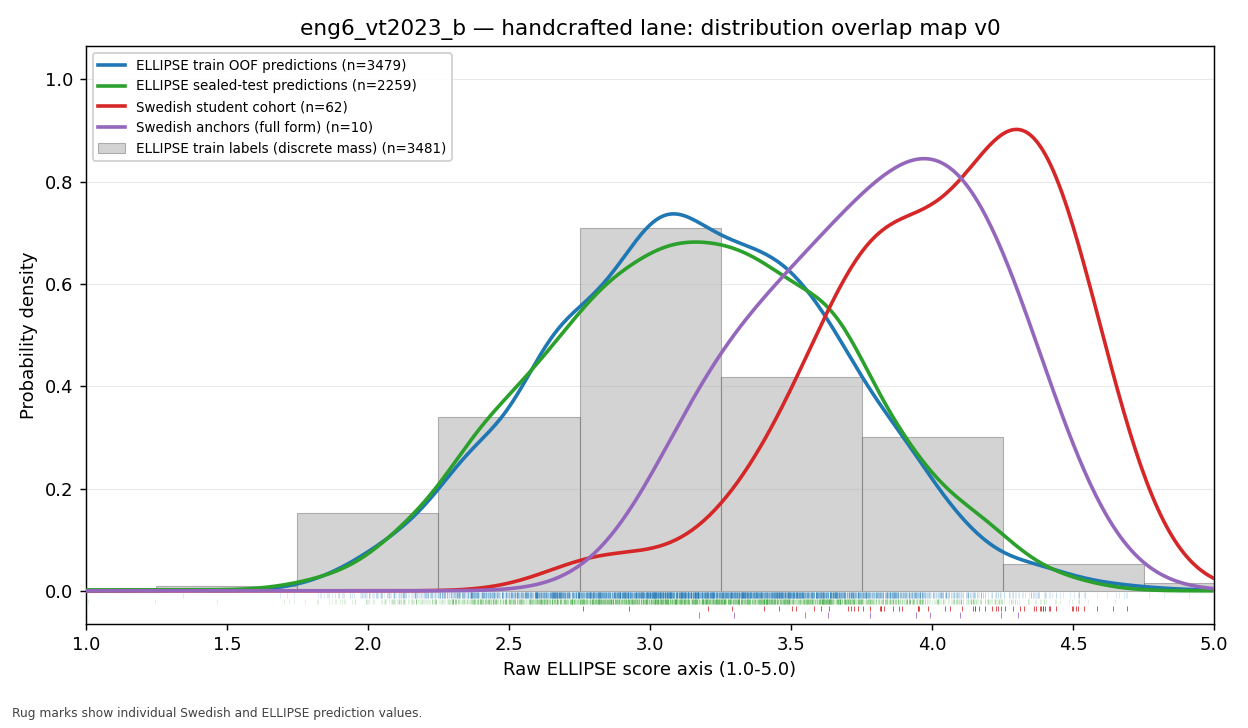
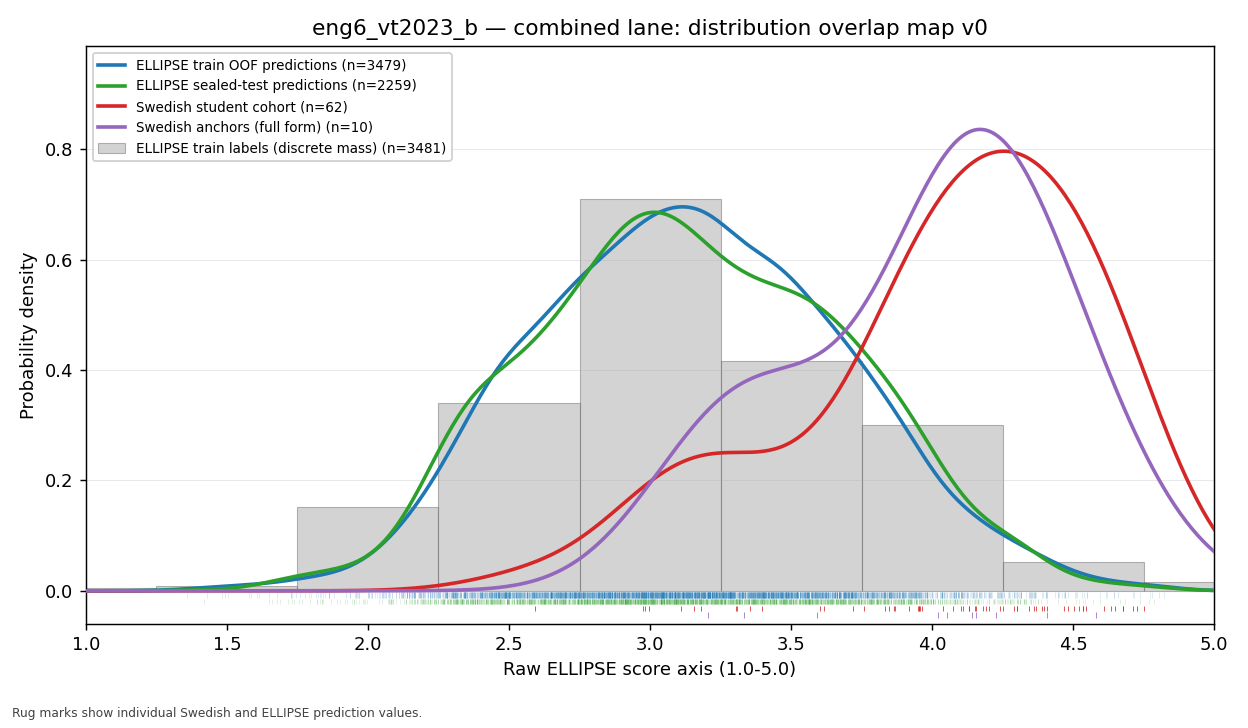
English 6 VT2026 anchors
English 7 VT2017
English 7 VT2018
Qualifications
Small samples. English 7 VT2018 contains seven classroom essays. The English 6 VT2026 and English 7 VT2018 anchor sets contain nine essays each. Their medians and individual observations are reported, but their smooth density curves are uncertain.
One result above the nominal scale. One transparent-scorer result in English 6 VT2023 assignment A is 5.099. It is included in every statistic but exceeds the figure's 5.0 axis maximum. It is one gradient-boosting prediction outside the nominal range among 281 scored rows.
Boundary density. The density curves are not corrected at the 1.0 and 5.0 boundaries. Curve height near either boundary should not be interpreted as a corrected density estimate.
Descriptive evidence. The course ordering is evidence that the two ELLIPSE-trained scorers distinguish these cohorts. It does not establish that the ELLIPSE scale measures the same construct as Swedish grades. Official Swedish exemplars and teacher judgments are needed for that claim.
Data table
The complete statistics used for the tables and figures are available as CSV data.